Hi, I'm Jaleel Drones
Student Analyst
Data Science Analyst @ JPMC, Junior undergraduate student at University of Michigan , Ann Arbor.
Contact meAbout Me
My introduction
With a passion for technology and its real-world applications. I thrive on solving complex problems with data-driven insights and am actively building my technical foundation through hands-on projects in Python, SQL, and data visualization. Beyond the classroom, I’m committed to fostering diversity in tech as a member of NSBE Professionals and ColorStack, where I engage in mentorship, networking, and skill-building. I excel in collaborative environments and enjoy working on innovative solutions at the intersection of technology and finance.
languages
experience
Skills
My technical levelProgramming Languages
C++
SQL
JavaScript
Python
HTML
IT Constructs
DS & Algorithms
OOP
Technologies
Git
React.js
MySQL
Firebase
Academics
My personal journeyUniversity of Michigan, Ann Arbor
B.A. Computer ScienceProjects
Most recent work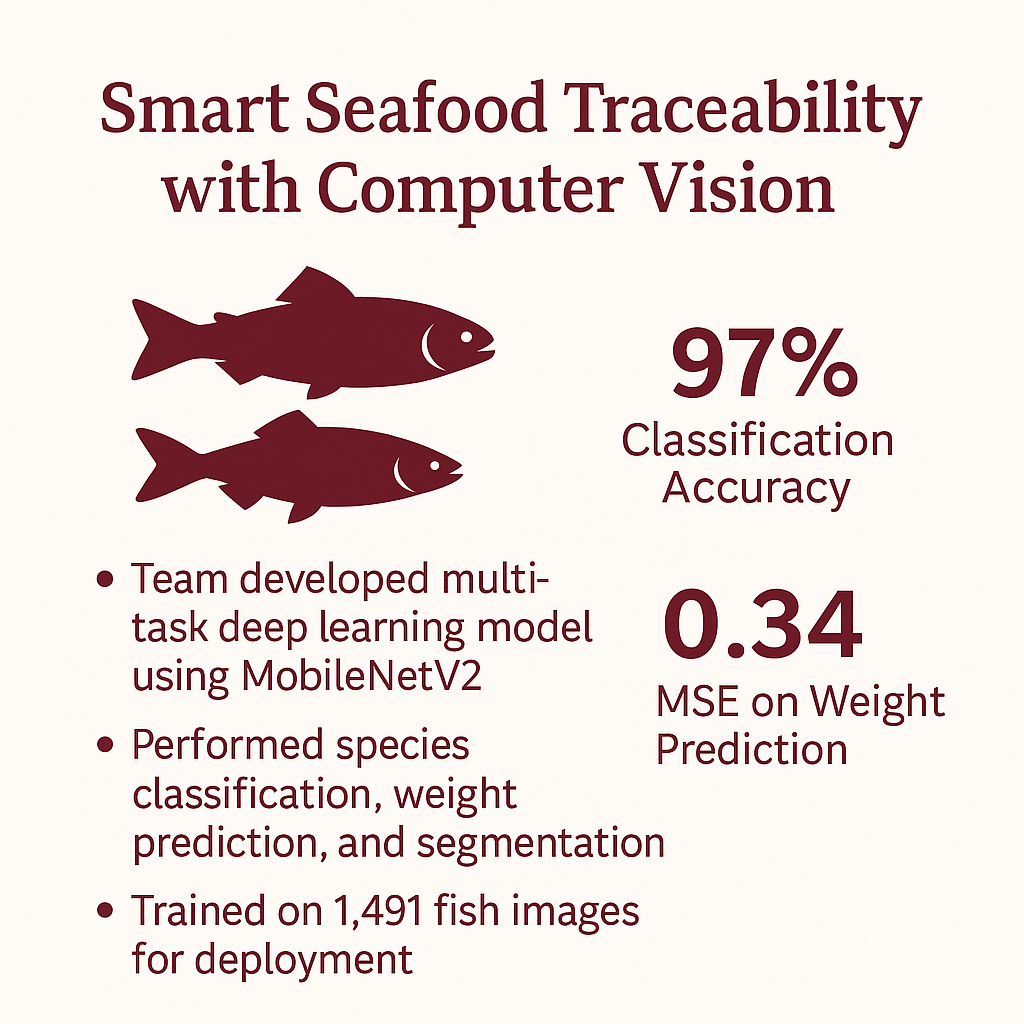
Remora Project: Smart Seafood Traceability with Computer Vision
As part of the University of Chicago Data Science Institute’s Summer Lab, I worked on a team with Remora Technologies to develop an AI-powered tool for seafood traceability and sustainability. Our goal was to replace unreliable fish scales with a computer vision system that could automatically identify fish species, estimate length and weight, and support regulatory compliance efforts in global fisheries. The project was presented at the UChicago DSI Symposium and supported by the 11th Hour Project.
See Live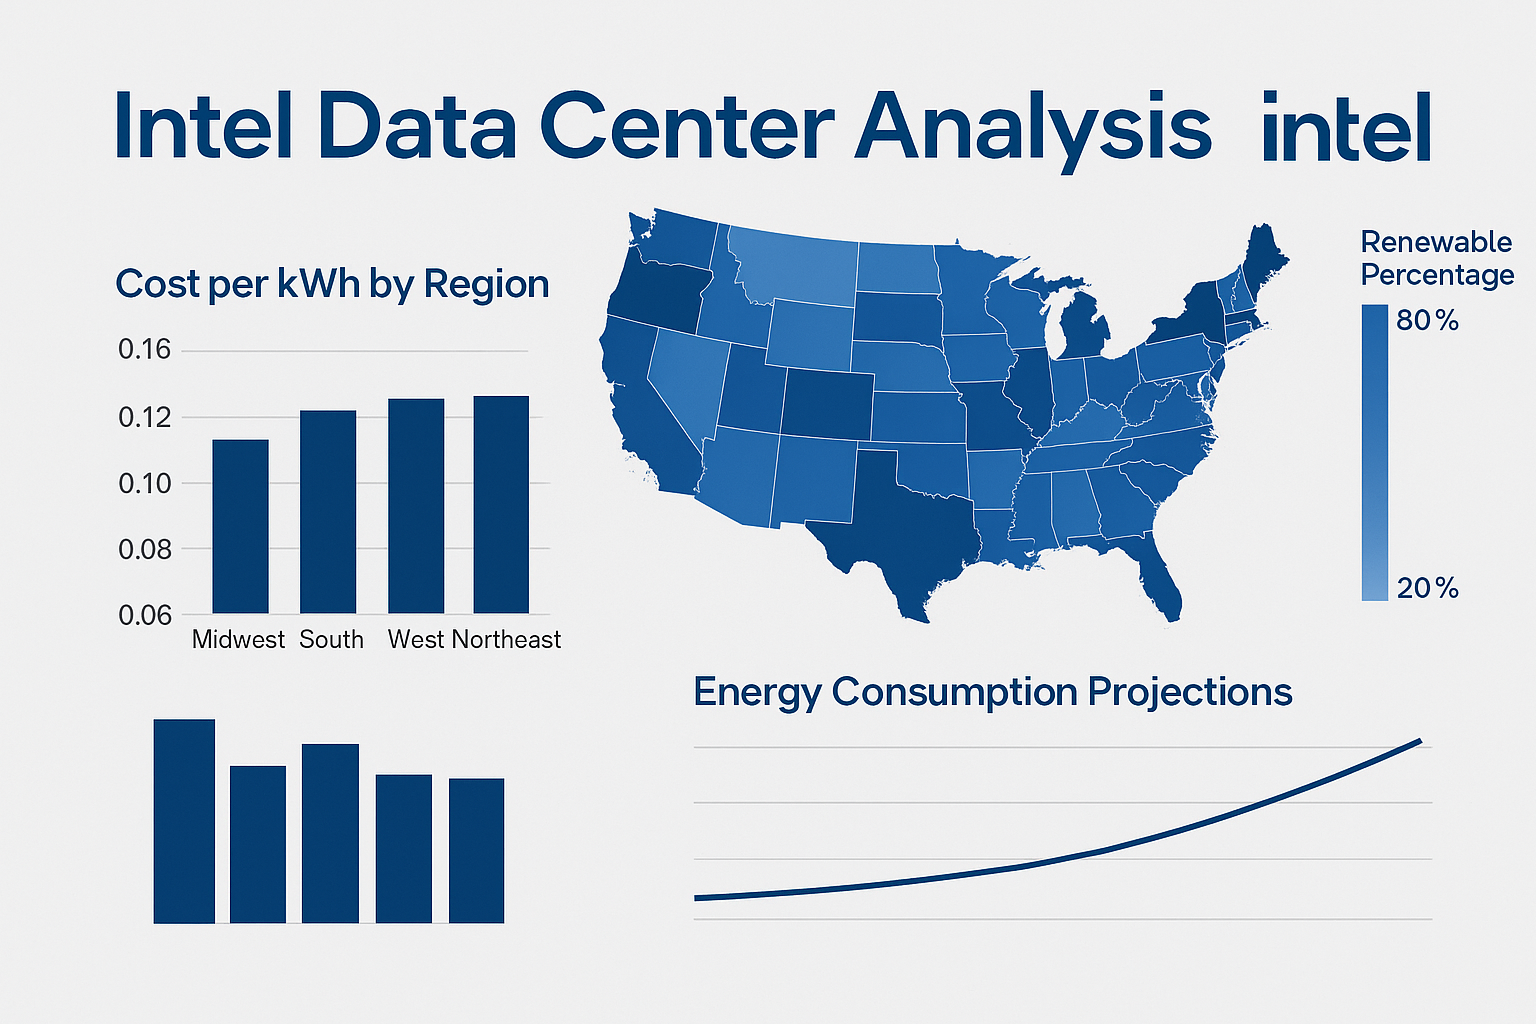
Intel Project - Data Analysis for Sustainability
In March 2025, co-designed with Intel’s Sustainability Team, I authored SQL queries against three datasets—daily regional energy data, plant-level generation figures, and power-plant metadata—to surface trends critical for new data-center site selection . After joining and aggregating over 2,500 plant records, I crafted eight Tableau dashboards illustrating net energy production by region, percentage of renewable generation, hourly renewable trends, and state-level energy breakdowns. From these visualizations, I recommended the Pacific Northwest as the optimal region—its top-three ranking in both net production and renewable share ensures cost efficiency and sustainability for Intel’s next facility
Certification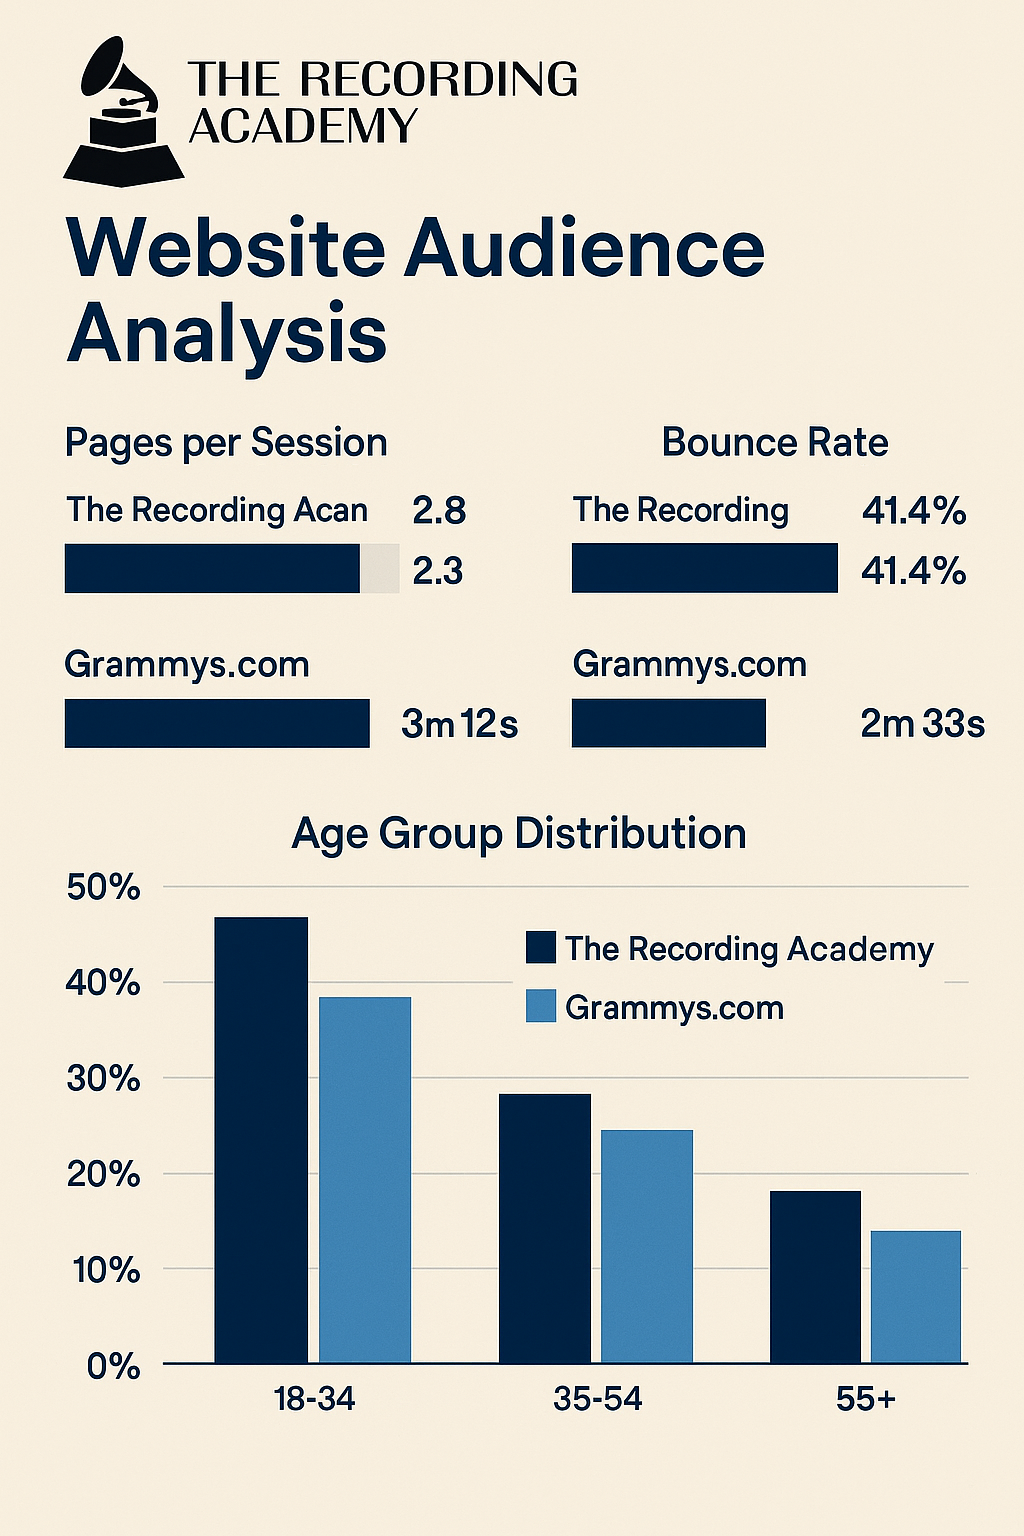
The GRAMMYs Project - Website Audience Analysis
In May 2025, with The Recording Academy to dissect and compare daily session-level traffic on RecordingAcademy.com versus Grammys.com. Working with over 1,800 rows of data in Python, I used Pandas and NumPy to clean and merge separate CSVs, engineered key engagement metrics (pages per session, bounce rate, average session duration), and built interactive charts with Plotly Express. My analysis revealed that RecordingAcademy.com visitors stayed 25 % longer and bounced 7 % less than on Grammys.com, and that Grammys.com skews younger (18–34) while RecordingAcademy.com attracts an older audience (35+) . These insights helped inform targeted content strategies and UX optimizations to better serve each audience segment.
Certification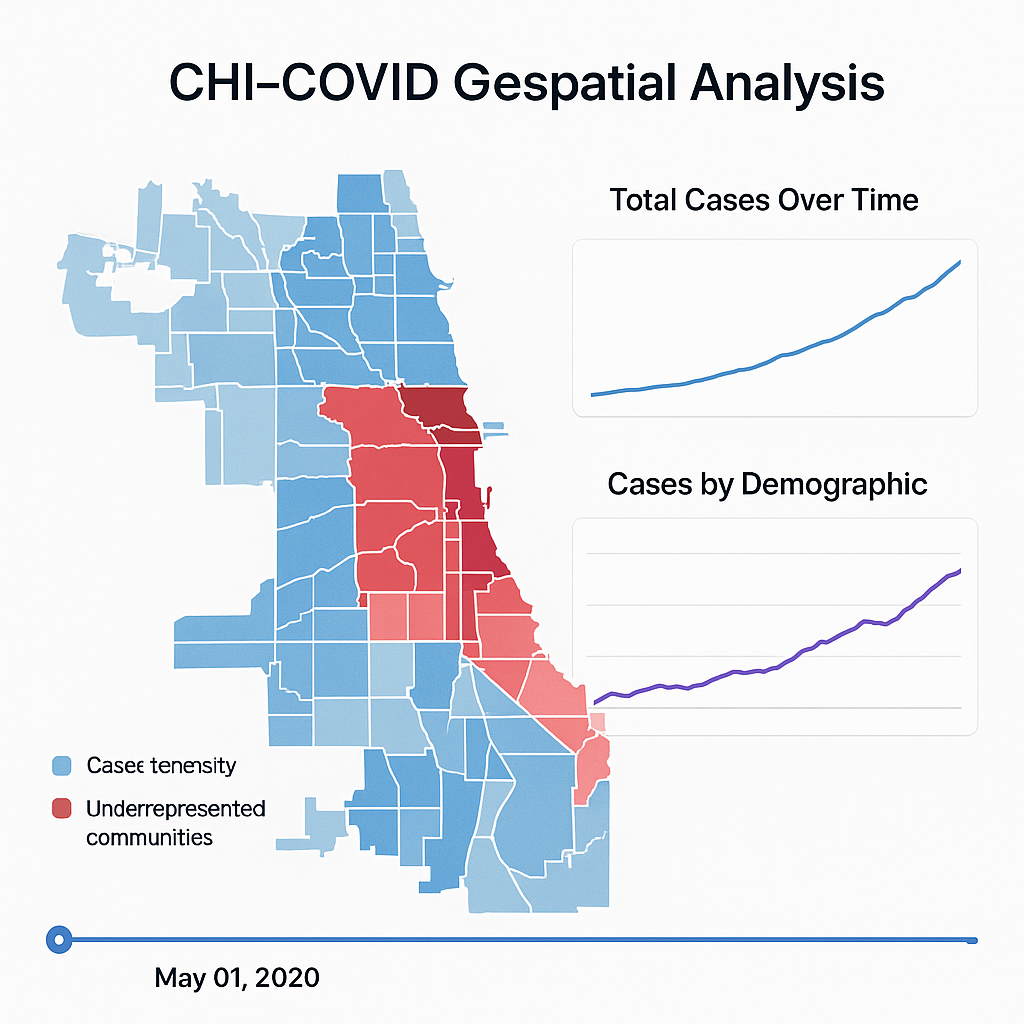
CHI-COVID
Processed and examined a GeoJSON dataset to calculate COVID-19 case and death rates per 1,000 Chicago residents, determining high-risk areas within city limits.Utilized GeoPandas and Pandas for data cleaning, transformation, and aggregation,
GitHub Repository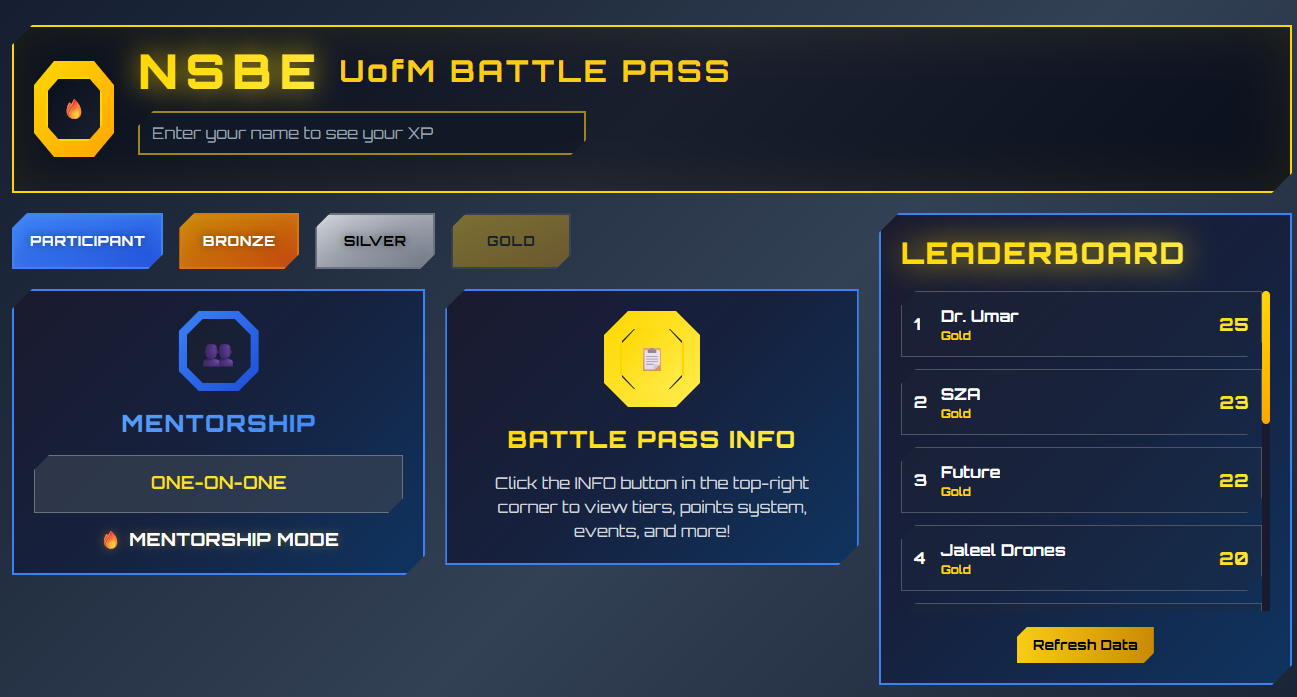
NSBEUM Battle Pass 2.0
Developed a Futurist Battle Pass for the National Society of Black Engineers at the University of Michigan, integrating gamification elements to enhance engagement and participation. The project involved designing a user-friendly interface
GitHub Repository NSBE Website